Autonomía digital y tecnológica

Código e ideas para una internet distribuida

Linkoteca. Archivo de navegación


In general street food vendors on a block means more pedestrian foot traffic round the clock, if they’re open late, that’s more eyes in a neighborhood. Additionally in an area with many dark empty storefronts, literally adds light and vitality to the area.

In her book The Death and Life of Great American Cities, Jane Jacobs wrote about the importance of “having eyes on the street” and foot traffic to building successful neighborhoods:

A city street equipped to handle strangers, and to make a safety asset, in itself, out of the presence of strangers, as the streets of successful city neighborhoods always do, must have three main qualities:

First, there must be a clear demarcation between what is public space and what is private space. Public and private spaces cannot ooze into each other as they do typically in suburban settings or in projects.

Second, there must be eyes upon the street, eyes belonging to those we might call the natural proprietors of the street. The buildings on a street equipped to handle strangers and to insure the safety of both residents and strangers, must be oriented to the street. They cannot turn their backs or blank sides on it and leave it blind.

And third, the sidewalk must have users on it fairly continuously, both to add to the number of effective eyes on the street and to induce the people in buildings along the street to watch the sidewalks in sufficient numbers. Nobody enjoys sitting on a stoop or looking out a window at an empty street. Almost nobody does such a thing. Large numbers of people entertain themselves, off and on, by watching street activity.

“La mayoría de la gente no vive así. Pero es tan desproporcionado lo que ves en redes sociales que empiezas a pensar que eres tú quien está haciendo algo mal. Es un ciclo muy dañino”, apunta la autora en una videollamada. Para Hoffman, que defiende no compartir solo lo perfecto, detrás de muchas de esas publicaciones hay también “muchos temas de clase y de dinero” de los que no se habla. Como ejemplo, menciona las fotografías de despensas en las que todo está fuera de su embalaje original, en recipientes a juego y bien etiquetados. “Es muy atractivo visualmente, pero el almacenamiento es extremadamente caro. Comprar todas esas cosas a juego no está al alcance de mucha gente”, apunta.

La psicóloga Aurora Gómez, de Corio Psicología, coincide: “A mí me encantaría que, igual que se dice que una publicación ha sido patrocinada, se dijera ‘esta persona tiene unos privilegios de base que no estás viendo”. La mayor parte de la población española vive en pisos pequeños, con poca luz y mal aislados, como quedó patente durante el confinamiento. Gómez admite que ella sigue muchas cuentas de decoración, pero se da cuenta de que son siempre casas grandes. “Buena disposición, buena iluminación, muchas plantas… Pero para las plantas, aunque no lo parezca, tienes que tener tiempo, dinero y luz”, opina. Las redes sociales contribuyen a configurar “lo que es una casa ideal”. Nos comparamos no solo con los mejores momentos de otros, sino con los mejores momentos de las casas de personas con más dinero.

“Limpiar y mantener una casa limpia, eso son habilidades que se pueden aprender y para las que hay gente que tiene obstáculos. Que tu casa sea o no un desastre no es un reflejo de quién eres como persona”, afirma Hoffman. Un ejemplo de cómo se ha asociado la limpieza con una cierta moralidad es cómo muchas veces, al recibir a alguien en casa, el anfitrión se disculpa por no tenerla perfecta. “Creo que en general tenemos que dejar de disculparnos por cómo vivimos. Hacerlo constantemente refuerza ese estándar inalcanzable al que aspiramos y es dañino”, subraya.

Captura de pantalla de cobalt-7.kwiatekmiki.com

cobalt is your go-to place for downloads from social and media platforms. zero ads, trackers, or other creepy bullshit. simply paste a share link and you’re ready to rock!

UfYH uses a system I call 20/10s. It’s 20 minutes of cleaning followed by a ten-minute break. This interval is totally adjustable! If 45/15s or 60/20s or 5/45s work better for you, do that instead! Everything in this system is flexible.

DON’T PUT IT DOWN, PUT IT AWAY. Probably 75% of our mess is made up of things we didn’t put away. Whether it belongs in a drawer, in the closet, in the trash, or in the cabinet, make sure it finds its way home.

Most of the rest of our mess is because we have too much stuff and not enough places to put it. There are two solutions: less stuff, or more storage. Less stuff is, in the long run, almost always the better solution.

YOU DO NOT HAVE TO UNFUCK EVERYTHING ALL AT ONCE. In fact, you shouldn’t. That’s how burnout happens. One thing at a time.

TAKE BREAKS. It’s important for your state of mind. You can integrate cleaning into everything else you do. It doesn’t have to be all-or-nothing.

You can only change your own habits. If you’re dealing with roommates or spouses or kids or parents who aren’t on board, the best you can do is tell them what you’re doing (trying to keep ahead of the mess), and ask them to help to not make it worse. Getting passive-aggressive or resentful because other people aren’t playing along only hurts you, and it’s not good for your brain.

A little effort now saves you a lot of work in the long run. That’s why I advocate getting your stuff together at night for the next morning. That’s why I like dumping some cleaner in the toilet or tub or sink and letting it start to work while I do something else. That’s why taking the extra five seconds to wash your fork or put it in the dishwasher will always be a good idea.

Multi-page feature was added in Inkscape 1.2. Its front end was implemented as a new Pages Tool in the toolbar.

Multi-page documents can be imported with their pages appended as new pages in the existing document. Select the correct option in the window that pops up to append pages rather than import shapes as usual. This can be used to merge multiple PDF files.

Saving a multi-page document to a format capable of storing multiple pages (e.g., PDF) will automatically save all pages. Exporting individual pages can be done in the new export dialog in batch mode. It is also possible to export each individual page in the Single export tab. Use this to split SVG or PDF documents into individual pages. Note: it’s not yet possible to select a sub-selection of multiple pages to export.

Refund fraud groups, organized like businesses, are exploiting lenient refund policies, robbing retailers of billions of dollars, experts told CNBC.

Fraud groups are taking advantage of retailers’ lenient return policies, experts told CNBC, which often include unlimited free returns and sometimes even a preference that customers keep the items. It’s ballooned into a massive problem for retailers, costing them more than $101 billion last year, according to a survey by the National Retail Federation and Appriss Retail. The figure includes multiple forms of fraud, such as sending back clothing after it’s been worn, known as “wardrobing,” and returning shoplifted merchandise, the survey said.

CNBC viewed several active refund fraud services on encrypted messaging app Telegram, each with thousands of followers. Updates are posted almost daily of new stores on their services, or new retailers that have been successfully targeted. Amazon and Apple are frequently hit, along with Nike, eBay, Saks Fifth Avenue and Ralph Lauren. Some groups even offer their services for DoorDash and Uber Eats orders, claiming users can “eat for free.”

Mail-in fraud involves a user filling out a company’s return form, but instead of sending back the purchased product, users will mail an empty box or a package filled with junk. In the case of Simple Refunds, Al-Maarej, the man who allegedly operated the group, sent an unnamed retailer “an envelope filled with plastic toy frogs” instead of the tools he claimed he was returning, prosecutors said.

TL;DR: The document is a firm restatement of a ban on using services like Google Workspace and Microsoft 365 in French schools, citing data privacy, the sensitivity of student information, and the need for educational neutrality. It emphasizes the use of French and European alternatives.

Ban on Non-Sovereign Solutions: The Ministry of Education strictly prohibits the use of non-sovereign (non-European, and particularly US-based) online collaborative suites in schools and educational institutions. This applies to both administrative/school management uses and pedagogical (teaching) uses.

Reasons for the Ban:

Sensitive Data: The Ministry considers data handled in educational settings to be highly sensitive for several reasons:
Exchanges between teachers and families may contain health information or information about disabilities (sensitive under GDPR Article 9).
The content of communications (absence dates, homework, etc.) could indirectly reveal sensitive personal data (racial/ethnic origin, political opinions, religious beliefs).
Data related to students is inherently sensitive because most students are minors.
Educational Neutrality: Schools must remain neutral regarding commercial software. Students should be taught digital collaboration skills in a way that’s independent of any specific commercial platform. This fosters critical thinking and responsible use of digital tools.

D3 and Next are the perfect combination for seamlessly creating reusable, extensible and component-driven interactive dashboards that can be used in literally any industry you can imagine.
With Next JS we can weild the high speed and performance powers to make the UI/UX even more pleasing due to prefetching of all the data that the dashboard is populated with.

Our favorite, most-read or most distinct work since 2014.

Five years ago today, The New York Times introduced The Upshot with the aim of examining politics, policy and everyday life in new ways. We wanted to experiment with formats, using whatever mix of text, data visualizations, images and interactive features seemed best for the subject at hand.

L’envie de faire cet épisode aurait pu naître de la gigantesque panne informatique la plus massive de l’histoire, dit-on, qui a eu lieu avant l’été, donc ces milliers d’ordinateurs qui sont tombés en rade à cause d’un bug survenu après la mise à jour d’un logiciel de sécurité. Ça aurait pu être ça, mais non, en fait tout part d’une coïncidence beaucoup plus anecdotique.

why does this particular conversion seem to present so many problems?

I think there are three main reasons:

1. The sort of people that visualise data on Google Maps / Bing Maps are (typically) not GIS professionals. This comment is not in anyway meant to belittle the quality of their data or output. However, the fact is that most GIS professionals still use the commercial (expensive) ESRI ArcGIS product set, and free tools such as Google / Bing are always more likely to attract casual spatial developers. As such, these developers are less likely to know (or want to know) about things like datums, coordinate systems, projections – they just want a map that works.

2. The EPSG code assigned to the projection has changed several times and much of the information displayed on the internet, as well as used in spatial applications themselves, is out-of-date. You’ll see references to EPSG 900913, 3857, 3785, 3587, and various different definitions of each of those systems.

3. The actual projection used by Microsoft / Google itself is (a bit of) a hack, which can lead to misalignment issues when your code actually does the projection the “correct” way. For example, it is common to find issues raised across a number of tools that conversion between WGS84 and Bing / Google Maps leads to Y values that are “out” by about 20km – see the Proj.NET issues here, here, here, here, and here, the ArcGIS API for Silverlight issue here, or the issue for the Proj.4 library reported here, for example.

Confusion over the EPSG Code

Coordinate systems are defined using a set of parameters, including the type of projection used (Mercator, Albers etc.), coordinate offset (False Easting, False Northing), the unit of measurement (Metre, Foot etc.), the underlying datum (WGS84, NAD27 etc.) and many more.

Because it’s quite a pain to have to keep quoting this complete set of parameters, every system is commonly referred to by a unique integer code (also called it’s SRID) instead. The set of SRIDs assigned to spatial reference systems in mainstream usage was originally set up by the European Petroleum Survey Group, and they are generally referred to as EPSG codes.

Captura de pantalla de openmaptiles.org

The vector tile schema describes how the vector data is organized into different thematic layers and which attribute and values each layer contains. This is useful for writing a map style and allows for alternative implementations of a schema.

The OpenMapTiles schema is open (CC-BY) and you are free to use, extend or build upon the existing implementation (BSD license). Attribution is required. Please properly reference OpenMapTiles if you build upon the schema.

The vector tile schema has been developed by Klokan Technologies GmbH and was initially modelled after the cartography of the Carto Basemap Positron. The vector tile schema has been refined and improved in cooperation with the Wikimedia Foundation and is heavily influenced by the many years Paul Norman’s experience of creating maps from OpenStreetMap.

Data visualization is the graphical display of abstract information for two purposes: sense-making (also called data analysis) and communication. Important stories live in our data and data visualization is a powerful means to discover and understand these stories, and then to present them to others. The information is abstract in that it describes things that are not physical. Statistical information is abstract. Whether it concerns sales, incidences of disease, athletic performance, or anything else, even though it doesn’t pertain to the physical world, we can still display it visually, but to do this we must find a way to give form to that which has none. This translation of the abstract into physical attributes of vision (length, position, size, shape, and color, to name a few) can only succeed if we understand a bit about visual perception and cognition. In other words, to visualize data effectively, we must follow design principles that are derived from an understanding of human perception.

Nothing beats the bar chart for fast data exploration and comparison of variable values between different groups, or building a story around how groups of data are composed.

The advantage of bar charts (or “bar plots”, “column charts”) over other chart types is that the human eye has evolved a refined ability to compare the length of objects, as opposed to angle or area.

Luckily for Python users, options for visualisation libraries are plentiful, and Pandas itself has tight integration with the Matplotlib visualisation library, allowing figures to be created directly from DataFrame and Series data objects. This blog post focuses on the use of the DataFrame.plot functions from the Pandas visualisation API.

This shortcut is not set by default: Shortcut Keys for LibreOffice Writer – LibreOffice Help so you need to create your own customized shortcut:

  1. Tools | Customize.
  2. Keyboard tab.
  3. In Shortcut window select keyboard shortcut combination you would like to have.
  4. From Category window select Insert.
  5. From Function window select Footnote/Endnote.
  6. Click on Modify button.
  7. Click on OK button to close dialog.
  8. Execute keyboard shortcut you defined.
Iñaki Alonso dentro de su propia casa en Entrepatios. Fotografía de Samuel Sánchez

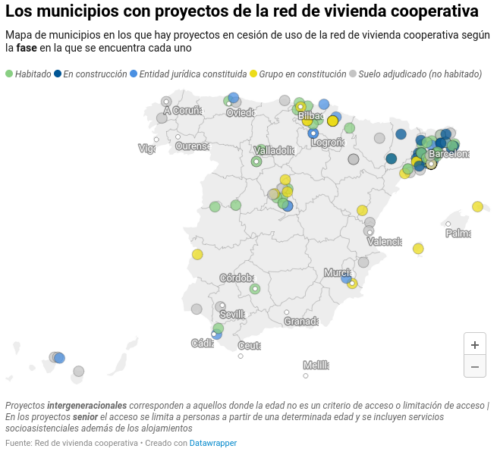
El derecho de uso es un modelo de propiedad colectiva. Para construir el edificio se constituye una cooperativa, como se hace en otras muchas promociones, pero luego esa cooperativa se usa también para su gestión. La cooperativa es la propietaria de todo el edificio y cada uno de los miembros de la cooperativa tenemos el derecho de uso de una vivienda. Estas casas no se pueden vender, lo que evita que se especule con ellas. Cuando alguien se quiere ir, se le devuelve su aportación al capital social y entra otra persona. Es como un híbrido entre la propiedad y el alquiler, porque en el fondo si que eres propietario, aunque de una manera colectiva, y también tienes que pagar una cuota mensual [para devolver el préstamo al banco y de gastos de comunidad] que es como un alquiler, pero un 20 o un 30% más barata que los precios de mercado. Esto te garantiza una vivienda para toda la vida. No la puedes vender, pero sí la pueden heredar tus hijos.

El modelo de derecho de uso soluciona una cuestión importante, que es la protección permanente de la vivienda.

En España hoy en día solo hay un 2% de viviendas públicas de protección oficial. Se construyeron muchas más, pero con el tiempo se han ido desprotegiendo e incorporando al mercado libre. La vivienda pública tiene que ser de protección permanente, como pasa en el País Vasco. Con el derecho de uso hay una protección permanente, la gente entra y sale, pero no se desprotege con el tiempo. El modelo de vivienda en derecho de uso cumple una función antiespeculativa.

P. En su edificio de Entrepatios tienen cuarto común de lavadoras, taller compartido de herramientas, salas con cocinas colectivas. ¿Por qué es tan importante esto en el diseño del edificio?

R. Se trata de generar relaciones entre las personas. Cuando la gente baja a poner la lavadora se encuentra con otros vecinos, hay conversaciones. Aunque cada uno cuenta con cocina en su casa, tener otras compartidas ayuda a construir posibilidades de relaciones, se puede quedar a comer todos juntos. Y esto va más allá de los espacios comunes, es una cultura colaborativa, de cuidados entre los vecinos. Al final, resumiendo mucho, lo que buscamos es vivir mejor. Porque pagamos menos en energía, porque somos coherentes con nuestros principios, porque nos cuidamos entre los vecinos.

Richard Stallman (aka “RMS”) is the founder of GNU and the Free Software Foundation and present-day voting member of the Free Software Foundation (FSF) board of directors and “Chief GNUisance” of the GNU project. He is responsible for innumerable contributions to the free software movement, setting its guiding principles, organizing political action, and directly contributing to a flourishing free software ecosystem. The majority of Stallman’s political activity has been of priceless value to society at large.

However, Stallman has been the subject of numerous allegations of misconduct. Stallman has also incited numerous controversies for advancing a political agenda which normalizes sexual misconduct and advocates for reforming our social and legal understanding of sexual conduct in a manner which benefits the perpetrators of abuse.

On the basis that Stallman has not demonstrated an understanding of his misconduct; has not apologized for allegations of misconduct, alleged or corroborated; continues to publish his harmful political program; and does not acknowledge or apologize for harm done in the course of this program, this report reiterates the position that Stallman should be removed from the board of directors at the Free Software Foundation.

Here is a list of either anti-capitalist, anti-hierarchy, autonomous, feminist, or radical server projects.

Some of them are revolutionary collectives which provide free or mutual aid services to radical and grassroots activists.

Others are more focused on privacy or on decentralisation.

None of them are focused on money.

Riseup is not endorsing these projects, but is keeping a list for people to be able to choose!

Accessibility in infographics and data visualizations ensures that all users, including those with disabilities, can access and understand the information presented. This is not just a matter of compliance with accessibility standards like the Web Content Accessibility Guidelines (WCAG), but also an intrinsic element of inclusive design.

With that said, to truly make data-driven content accessible to all users, including those with visual impairments, following accessibility guidelines and design techniques is essential. In this short guide, we’ll examine proven techniques for creating accessible infographics and data visualizations that are inclusive and understandable to a wide audience.

Forms are commonly used to provide user interaction on websites and in web applications. For example, login, registering, commenting, and purchasing. This tutorial shows you how to create accessible forms. The same concepts apply to all forms, whether they are processed client or server-side.

Aside from technical considerations, users usually prefer simple and short forms. Only ask users to enter what is required to complete the transaction or process; if irrelevant or excessive data is requested, users are more likely to abandon the form.

Forms can be visually and cognitively complex and challenging to use. Accessible forms are easier to use for everyone, including people with disabilities.

  • People with cognitive disabilities can better understand the form and how to complete it, as making forms accessible improves the layout structure, instructions, and feedback.
  • People using speech input can use the labels via voice commands to activate controls and move the focus to the fields that they have to complete.
  • People with limited dexterity benefit from large clickable areas that include the labels, especially for smaller controls, such as radio buttons and checkboxes.
  • People using screen readers can identify and understand form controls more easily because they are associated with labels, field sets, and other structural elements.
Captura de pantalla de jacomyma.github.io/mapping-controversies/

This tutorial material consists of 21 modules of 15 to 45 minutes, for 2 full days in total. It covers some of the technical / practical aspects of controversy mapping with digital methods. As such, it is designed to complement teaching on the controversy mapping course.

Goal: learn how to harvest and explore data, formulate insights, and build relatable visualizations.

Data: we will mostly use Wikipedia data to keep things relatively simple, but the techniques generalize to other media platforms and datasets.

Tools: we will mostly use Tableau, Gephi, and Jupyter Notebooks. No experience required.

Retrofitting is the addition of new technology or features to older systems. Retrofits can happen for a number of reasons, for example with big capital expenditures like naval vessels, military equipment or manufacturing plants, businesses or governments may retrofit in order to reduce the need to replace a system entirely. Other retrofits may be due to changing codes or requirements, such as seismic retrofit which are designed strengthening older buildings in order to make them earthquake resistant.

Retrofitting is also an important part of climate change mitigation and climate change adaptation: because society invested in built infrastructure, housing and other systems before the magnitude of changes anticipated by climate change. Retrofits to increase building efficiency, for example, both help reduce the overall negative impacts of climate change by reducing building emissions and environmental impacts while also allowing the building to be more healthy during extreme weather events. Retrofitting also is part of a circular economy, reducing the amount of newly manufactured goods, thus reducing lifecycle emissions and environmental impacts.

Actor–network theory (ANT) is a theoretical and methodological approach to social theory where everything in the social and natural worlds exists in constantly shifting networks of relationships. It posits that nothing exists outside those relationships. All the factors involved in a social situation are on the same level, and thus there are no external social forces beyond what and how the network participants interact at present. Thus, objects, ideas, processes, and any other relevant factors are seen as just as important in creating social situations as humans.

– Would it be correct to say that treating an issue such as climate change as a matter of concern as opposed to a matter of fact would be the difference between questioning the evidence for the sake of questioning it and recognising that the specifics of the evidence don’t matter in the face of the danger it poses?

– I would say yes. As he writes in the essay, if you’re worried about climate change as a matter of fact, then you worry about establishing this fact scientifically. But as he points out, the conservative climate-change deniers don’t really care about the scientific fact, they only pretend. So our response to these deniers should not be to insist that climate change is a fact, but to insist that it matters (i.e. is a matter of concern).

Awesome European Tech. Número de proyectos por país

Up-to-date, community-driven list of Awesome European Tech projects! all focusing on privacy, sustainability, and innovation. The goal is to support European startups and projects (Compliance to GDPR, UK GDPR, Swiss FADP) helping to strengthen the European tech ecosystem.

Acceptance Criteria

Compliance: Must adhere to GDPR, UK GDPR, Swiss FADP, or other relevant European data protection frameworks.
European Headquarters: The company or project must be based in Europe.
Technology Focus Must be a company or project that leverages technology as a core component of its operations, products, or services.

Interestingly, when I fed all my symptoms and medical data from before the rheumatologist visit into GPT, it suggested the same diagnosis I eventually received. After sharing this experience, I discovered many others facing similar struggles with fragmented medical histories and unclear diagnoses. That’s what motivated me to turn this into an open source tool for anyone to use. While it’s still in early stages, it’s functional and might help others in similar situations.

https://github.com/OpenHealthForAll/open-health

**What it can do:**

* Upload medical records (PDFs, lab results, doctor notes)

* Automatically parses and standardizes lab results:

– Converts different lab formats to a common structure

– Normalizes units (mg/dL to mmol/L etc.)

– Extracts key markers like CRP, ESR, CBC, vitamins

– Organizes results chronologically

* Chat to analyze everything together:

– Track changes in lab values over time

– Compare results across different hospitals

– Identify patterns across multiple tests

* Works with different AI models:

– Local models like Deepseek (runs on your computer)

– Or commercial ones like GPT4/Claude if you have API keys

**Getting Your Medical Records:**

If you don’t have your records as files:

– Check out [Fasten Health](https://github.com/fastenhealth/fasten-onprem) – it can help you fetch records from hospitals you’ve visited

– Makes it easier to get all your history in one place

– Works with most US healthcare providers

Escena de Volveréis

Volveréis (conocida como Septembre sans attendre en Francia) es una película hispano-francesa de comedia dramática de 2024, dirigida por Jonás Trueba, quien la coescribió junto a los actores Itsaso Arana y Vito Sanz, los cuales también protagonizan la película.

Portada del segundo libro de Frieren

Frieren: Beyond Journey’s End (Japanese: 葬送のフリーレン, Hepburn: Sōsō no Furīren, lit. ’Frieren at the Funeral’ or ‘Frieren the Slayer’) is a Japanese manga series written by Kanehito Yamada and illustrated by Tsukasa Abe. It has been serialized in Shogakukan’s shōnen manga magazine Weekly Shōnen Sunday since April 2020; its chapters have been collected in 13 tankōbon volumes as of April 2024.

Escena de En busca del Valle Encantado

The Land Before Time (En busca del valle encantado en España y La tierra antes del tiempo o Pie Pequeño: En Busca del Valle Encantado en Hispanoamérica) es una película estadounidense de animación estrenada en Estados Unidos el 18 de noviembre de 1988, dirigida por Don Bluth, producida por Universal Studios, Amblin Entertainment y Lucasfilm, contando con Steven Spielberg, George Lucas, Kathleen Kennedy y Frank Marshall como productores ejecutivos. Es destacable la banda sonora compuesta por James Horner (quien ya había trabajado previamente con Bluth en la musicalización de An American Tail), así como la interpretación del tema «If We Hold On Together», tema final de la película, por Diana Ross.

Escena de Cat on the Hot Tin Roof

at on a Hot Tin Roof is a 1958 American drama film directed by Richard Brooks (who co-wrote the screenplay with James Poe) based on the 1955 Pulitzer Prize-winning play of the same name by Tennessee Williams. The film stars Elizabeth Taylor, Paul Newman, Burl Ives, Jack Carson and Judith Anderson.

The Dunning–Kruger effect is a cognitive bias in which people with limited competence in a particular domain overestimate their abilities. It was first described by David Dunning and Justin Kruger in 1999. Some researchers also include the opposite effect for high performers: their tendency to underestimate their skills. In popular culture, the Dunning–Kruger effect is often misunderstood as a claim about general overconfidence of people with low intelligence instead of specific overconfidence of people unskilled at a particular task.

The try except statement can handle exceptions. Exceptions may happen when you run a program.

Exceptions are errors that happen during execution of the program. Python won’t tell you about errors like syntax errors (grammar faults), instead it will abruptly stop.

An abrupt exit is bad for both the end user and developer.

Instead of an emergency halt, you can use a try except statement to properly deal with the problem. An emergency halt will happen if you do not properly handle exceptions.

The idea of the try-except block is this:

  • try: the code with the exception(s) to catch. If an exception is raised, it jumps straight into the except block.
  • except: this code is only executed if an exception occured in the try block. The except block is required with a try block, even if it contains only the pass statement.

It may be combined with the else and finally keywords.

  • else: Code in the else block is only executed if no exceptions were raised in the try block.
  • finally: The code in the finally block is always executed, regardless of if a an exception was raised or not.
try:
    lunch()
except SyntaxError:
    print('Fix your syntax')
except TypeError:
    print('Oh no! A TypeError has occured')
except ValueError:
    print('A ValueError occured!')
except ZeroDivisionError:
    print('Did by zero?')
else:
    print('No exception')
finally:
    print('Ok then')
Poster de The Color of Money

Paul Newman called Martin Scorsese in September 1984 and asked him if he was interested in directing a sequel to The Hustler.

Newman said that the best advice he was given by Scorsese was to «try not to be funny». Cruise performed most of his own pool shots. An exception was a jump shot over two balls to pot another. Scorsese believed that Cruise could learn the shot, but that it would take too long, so the shot was performed for him by professional player, Mike Sigel. Cruise mentioned that, to prepare for the role, he bought a pool table for his apartment and practiced for hours on end. Standing in for the valuable Balabushka cue in the movie is a Joss J-18 (which became the Joss 10-N7), made to resemble a classic Balabushka.

Escena de The Color of Money

La España del toldo verde. Fotografía de Kike Carbajal

La segunda mitad del siglo XX, en pleno franquismo, fue la época de mayor construcción de vivienda en la historia de España. En solo 14 años, entre 1961 y 1975, se levantaron cuatro millones de pisos, en una operación sin precedentes. Si bien la construcción fue primero realizada por el Estado (mediante el Instituto Nacional de Vivienda), acabó, después del Plan de Estabilización de 1959 (obra del Gobierno tecnocrático formado, entre otros, por miembros del Opus Dei), siendo fiada a las grandes constructoras privadas, muchas de las cuales siguen dominando el sector.

En la posguerra, mediante el plan Bidagor, Madrid absorbe los municipios colindantes (Vallecas, Carabanchel, Chamartín, Hortaleza…) creándose el Gran Madrid. Entre 1940 y 1985 se levanta el 60% del Madrid actual. Y en 25 años la capital pasa de 800.000 habitantes a 3,2 millones, atraídos por la creciente oferta laboral en la industria y en la construcción (y a pesar de que en 1956 se promulgó una ley para impedir la llegada de extremeños, manchegos y andaluces sin dirección fija).

“Los barrios de toldo verde fueron primero ocupados por la migración interna, de otras regiones; más recientemente por la migración externa, de otros países; y ahora regresa a los barrios la gente que es expulsada de los centros urbanos, extendiendo los fenómenos de gentrificación”, explica Carbajal.

En las imágenes de Carbajal aparecen esos bares de barrio sin las ínfulas hipster del centro, bares sin adornos (no frills, como los denomina la periodista británica afincada en Lavapiés Leah Pattem), conocidos cariñosamente como bares de viejos, grasabares o bares Paco, de nombre normal y corriente como Casa Romero, El foro o La cañada. Balcones con macetas, banderas de España, camisetas tendidas, escaleras plegables, bicicletas, bombonas de butano o aparatos de aire acondicionado.

“La dictadura de Franco era un sistema corrupto y clientelar donde el régimen y los constructores se intercambiaban favores. Constructores y bancos se convierten en líderes de la economía, todavía hoy suponen un alto porcentaje del Ibex 35″. Fueron tiempos marcados por la expropiación, la recalificación, la urbanización y la especulación, sin preocupación por la calidad constructiva, lo estético o lo arquitectónico: un proceso que generó enorme riqueza para las élites urbanísticas.