Autonomía digital y tecnológica

Código e ideas para una internet distribuida

Linkoteca. OpenStreetMaps


In QGIS version 3, there are built-in features to use raster and vector data from OpenStreetMap. There is no built-in possibility to upload changes back to a OpenStreetMap server directly from QGIS. For this purpose, please use one of the Editors.

We are allowed to map certain facts from reference imagery in news articles etc.. -though this technically depends on where you are from-. You have to

  1. be fairly certain of the position of each object. They can be a few meters off, but you shouldn’t haphazardly map them.

  2. select sources which are reliable and mention them in your changeset sources or alternatively using the source and source:date tags.

  3. make sure you’re using the right imagery and (if any) offset. This can be adjusted in the editor’s layer menu (in iD, this is located in the right sidebar).

  4. be careful if/when touching existing objects. (You may want to contact the local community, if there is one, to discuss whether they want to map the event to begin with); This may change/remove objects on the map 1) ways which are used for routing 2) areas, such as buildings, or POIs which may be of interest for humanitarian aid.
    You will have to use the proper Lifecycle tags (in combination with area=yes where needed).

  5. be sure you know how to map with multipolygons where needed.

  6. as always, look on the wiki for tags and ask the community if you need help mapping.

OpenStreetMap offers many possibilities for creating high resolution paper maps. Unlike commercial map services such as Mapquest and Google Maps, there are only a few restrictions on what you can do with OSM images.

GUI written in Python to parse OSM (OpenStreetMap) files and render them onscreen. Layers may be toggled on/off and drawing may be customized.

This program allows a user to render OSM files within the GUI. The GUI enables the user to easily modify which layers are visible and the style of these layers.

The program exports maps as images.

a process by which you can generate your own custom-made stylized maps. A stylized map is a map where the user can specify which data layers are visualized, as well as define the style with which each layer is visualized. I will first describe the process through which you can write software to stylize maps, followed by an example of the Python software I wrote to perform this task.

Choose your region

The region is specified by a bounding box, which consists of a minimum and maximum latitude and longitude. Choose as small a region as will be useful to you, since larger regions will result in larger data files, longer download times, and heavier load on the server. The server may reject your region if it is larger than 1/4 degree in either dimension. When you’re first starting out, choose a very small region so that you can figure things out quickly with small data sets.

There are several ways of finding latitude and longitude values. Since we are interested in a bounding box, perhaps the clearest way is to use the bounding box selection features of the ‘export data’ link. On the homepage map pan and zoom to roughly the right area, and then click the ‘export data’ (link on the left). This sidebar display includes the four values you need for a bounding box matching the extents of the viewport. Click ‘Manually select a different area’ and then drag a box to select exactly the region you want.

Construct a URL for the HTTP API

You must now construct an API request URL as specified in the map request docs. In the URL, a bounding box is expressed as four comma-separated numbers, in this order: left, bottom, right, top (min long, min lat, max long, max lat). Latitude and longitude are expressed in decimal degrees. North latitude is positive, south latitude is negative. West longitude is negative, east longitude is positive. The method described in the previous section will give you suitable values.

Example:

https://api.openstreetmap.org/api/0.6/map?bbox=11.54,48.14,11.543,48.145

The API is limited to bounding boxes of about 0.5 degree by 0.5 degree and you should avoid using it if possible. For larger areas you might try to use XAPI, for example:

http://overpass.openstreetmap.ru/cgi/xapi_meta?*[bbox=11.5,48.1,11.6,48.2]

Refer to the XAPI page for details of other servers available.

Download the data

You can just type this URL into a browser if you want, but that may not work as well as you’d hope, especially if the data is large. If you know how to use them, command-line tools like wget and curl will do a better job.

If you’ve specified a region with a lot of data, you may have to wait a while before the HTTP response begins (the server is crunching your request). If your client times out, try setting options for a longer timeout, or choose a smaller region.

Here’s an example command line for wget:

wget -O muenchen.osm "https://api.openstreetmap.org/api/0.6/map?bbox=11.54,48.14,11.543,48.145"

So although many of us have to stay in, there are still ways that we can help—by simply improving the map. We’ve been talking with the mapping community to find out what the current mapping priorities are and how you can help. Here are some of the mapping attributes that are increasingly important in the current environment:

Hospitals/clinics including facilities and surrounds: This includes the opening hours, addresses, services provided, building outlines, and helipads for countries where air ambulances are commonly used.

Pharmacies: Opening hours, locations and addresses.

Supermarkets, marketplaces, and convenience stores: Opening hours, locations and addresses.

Banks, ATMs, electronic money transfers: Particularly important with global economic disruption.

We highly encourage mapping some of the above features in an area you care about. There are also some existing tasks that you can help complete.

Hospitals in the Philippines with MapRoulette

Global health sites mapping with Healthsites

Health care clinic information globally with MapContrib

Hospital outlines and surrounds in Qom, Iran with MapRoulette

Hospital outlines and surrounds in Tehran province, Iran with MapRoulette

Importing pharmacies in Catalonia, Spain with OSM Tasking Manager

Enriching hospital data in Istanbul with MapRoulette

Ces fichiers contiennent l’ensemble des communes françaises, y compris les DOM, Mayotte et Saint-Pierre-et-Miquelon. Pour Paris, Lyon, Marseille, ce sont les limites d’arrondissements qui sont fournies à la place des limites de communes.

Pour chaque commune ou arrondissement, les attributs suivants sont ajoutés:

insee: code INSEE à 5 caractères de la commune
nom: nom de la commune (tel que figurant dans OpenStreetMap, si possible conforme aux règles de toponymie)
wikipedia: entrée wikipédia (code langue suivi du nom de l’article)
surf_ha : surface en hectares de la commune

Meridian 2 vs OSM data bases

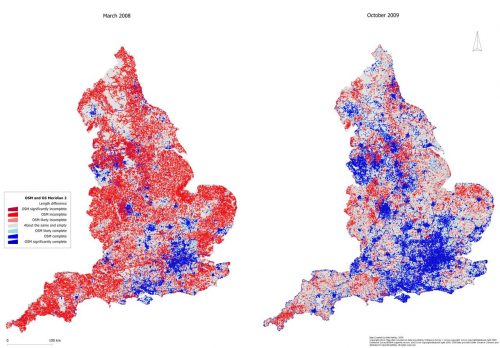
In March 2008, I started comparing OpenStreetMap in England to the Ordnance Survey Meridian 2, as a way to evaluate the completeness of OpenStreetMap coverage. The rational behind the comparison is that Meridian 2 represents a generalised geographic dataset that is widely use in national scale spatial analysis. At the time that the study started, it was not clear that OpenStreetMap volunteers can create highly detailed maps

Just a few hours after the 7.0 magnitude earthquake hit Haiti in January 2010, a group of collaborators from the OpenStreetMap community began collecting all sorts of topographical data about the country – roads, towns, hospitals, government buildings. Within forty-eight hours high-resolution satellite imagery taken after the earthquake became available, and within a month over 600 people had added information to OpenStreetMap of Haiti.

This online map quickly became the default basemap for a wide variety of responders – search and rescue teams, the United Nations, the World Bank, and humanitarian mapping organizations such as MapAction.