

GeoPandas. Reading and writing files
GeoPandas can read almost any vector-based spatial data format including ESRI shapefile, GeoJSON files and more using the geopandas.read_file() command
How to Access Built-In GeoPandas Datasets
…the geodatasets package. This new package, separated from the main GeoPandas library, focuses on access to and management of spatial datasets. We’ll walk you through installing geodatasets and demonstrate how it complements GeoPandas in handling geospatial information.

Make Better Bar Charts in Python using Pandas Plot
Nothing beats the bar chart for fast data exploration and comparison of variable values between different groups, or building a story around how groups of data are composed.
The advantage of bar charts (or “bar plots”, “column charts”) over other chart types is that the human eye has evolved a refined ability to compare the length of objects, as opposed to angle or area.
Luckily for Python users, options for visualisation libraries are plentiful, and Pandas itself has tight integration with the Matplotlib visualisation library, allowing figures to be created directly from DataFrame and Series data objects. This blog post focuses on the use of the DataFrame.plot functions from the Pandas visualisation API.
Media Cloud is an open-source platform for media analysis
Media Cloud is a suite of technologies that allow researchers to answer quantitative questions about the content of online media.
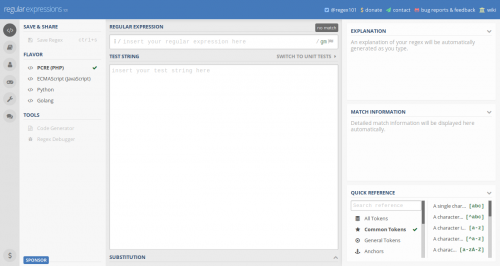
RegExr. Learn, build, & test Regular Expressions
RegExr is an online tool to learn, build, & test Regular Expressions (RegEx / RegExp).
Convert CSV to JSON in JavaScript
First I take the whole CSV file and split it into an array of lines. Then, I take the first line, which should be the headers, and split that by a comma into an array. Then, I loop through all the lines (skipping the first one) and inside, I loop through the headers and assign the values from each line to the proper object parameters. At this point, you probably want to just return the JavaScript object, but you can also JSON.stringify the result and return the JSON object.
Experimento de toma de datos en la calle en Bilbao de @numeroteca
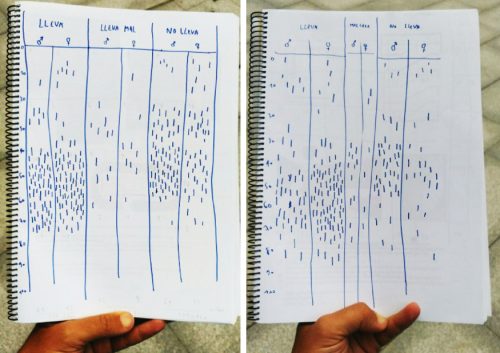
Me pilló el anuncio del uso obligatorio de mascarillas en Euskadi haciendo un experimento de toma de datos en la calle en Bilbao:
[ ] Lleva | [ ] Mal puesta | [ ] No lleva mascarilla
2 tomas de datos: 208 y 268 personas.
Clasificados por edad (eje vertical) y sexo
El mapa de la contratación pública en Cantabria
Explora 20.971 contratos del Gobierno de Cantabria y más de 4.000 licitadores. Una herramienta digital interactiva para la transparencia y el análisis desarrollada por Jaime Gómez-Obregón.
La tiranía de lo cuantificable
“la tiranía de lo cuantificable”, de la forma en la que lo que puede ser medido toma precedencia sobre lo que no puede serlo: el beneficio privado sobre el bien común; la velocidad y eficiencia sobre el disfrute y la calidad; lo utilitario sobre los misterios y significados más útiles para nuestra supervivencia…
La tiranía de lo cuantificable es en parte la incapacidad del lenguaje y del discurso para describir fenómenos más complejos, sutiles y fluidos, así como la incapacidad de aquellos que forman opiniones y toman decisiones para entender y valorar estas cosas más resbaladizas.
Curso de Introducción a R
Creemos que al final seréis capaces de utilizar R para cargar datos, arreglarlos, hacer gráficos y tablas, e informes en Rmarkdown.
Intentaremos que el curso sea fundamentalmente práctico, perso se necesita un mínimo de conocimiento sobre el funcionamiento de determinadas cosas y también hay que conocer un poco la jerga que se utiliza en la comunidad R.
En lugar de presentar todos los pormenores de R de manera lineal, se irán presentando distintos aspectos de R conforme se vayan necesitando; es decir, no vamos a presentar R como un lenguaje de programación sino como una herramienta para hacer análisis estadísticos.
3 top Python libraries for data science
NumPy (short for Numerical Python) is one of the top libraries equipped with useful resources to help data scientists turn Python into a powerful scientific analysis and modelling tool. The popular open source library is available under the BSD license. It is the foundational Python library for performing tasks in scientific computing. NumPy is part of a bigger Python-based ecosystem of open source tools called SciPy.
Pandas is another great library that can enhance your Python skills for data science. Just like NumPy, it belongs to the family of SciPy open source software and is available under the BSD free software license.
Matplotlib is also part of the SciPy core packages and offered under the BSD license. It is a popular Python scientific library used for producing simple and powerful visualizations. You can use the Python framework for data science for generating creative graphs, charts, histograms, and other shapes and figures—without worrying about writing many lines of code. For example, let’s see how the Matplotlib library can be used to create a simple bar chart.
Data Culture Project
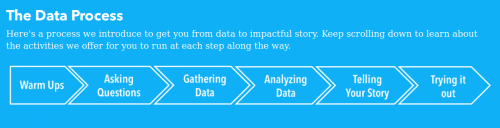
Data is everywhere right now. But many organizations like your’s are struggling to figure out how to build capacity to work with data. You don’t need a data scientist; you need a data culture.
Use our self-service learning program to facilitate fun, creative introductions for the non-technical folks in your organization. These are not boring spreadsheet trainings. The free tools and activites below are hands-on and designed to meet people where they are across your organization and build their capacity to work with data.
Introduction to the R language
an introduction to statistical software R. The course will introduce the student to the basics of using R for statistical programming, computation, graphics, and basic statistical modeling.
Anti-vaccines. When the problem is not just a question of resources
Some high-income countries have lowered their guard and their immunization rates have dropped. In certain countries, confidence in vaccines has begun to fall.
In fact, France is the country with the lowest vaccine confidence level, according to the project The Vaccine Confidence 2016, carried out by the London School of Hygiene and Tropical Medicine for which 65,819 people were interviewed in 67 countries. 40% of French respondents (vs. an average of 12% worldwide) responded that they disagreed or strongly disagreed with the following statement: “Vaccines are safe”.
Kaos 155: Herramienta para la obtención de datos de Contratación con la administración pública y relaciones societarias en España
¿Es necesario hoy en día saber programar para diseñar? ¿Cómo se puede medir este cambio?
Una de las formas posibles es comparando la necesidad del mercado de dichos conocimientos, analizando las ofertas de trabajo y viendo si ese “mix” de diseño y programación es más presente ahora que hace unos años.