OpenStreetMap and Ordnance Survey Meridian 2 comparison – 2008 – 2011
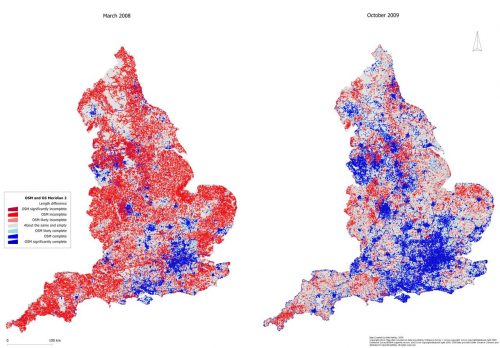
In March 2008, I started comparing OpenStreetMap in England to the Ordnance Survey Meridian 2, as a way to evaluate the completeness of OpenStreetMap coverage. The rational behind the comparison is that Meridian 2 represents a generalised geographic dataset that is widely use in national scale spatial analysis. At the time that the study started, it was not clear that OpenStreetMap volunteers can create highly detailed maps
Python script to add base maps to QGIS
This script should be run from the Python consol inside QGIS.
It adds online sources to the QGIS Browser.
Each source should contain a list with the folowing items (string type):
[sourcetype, title, authconfig, password, referer, url, username, zmax, zmin]
You can add or remove sources from the sources section of the code.
Script by Klas Karlsson
Sources from https://qms.nextgis.com/
Licence GPL-3
Learn OpenStreetMap Step by Step
Anyone can edit OpenStreetMap. Here you can learn how LearnOSM provides easy to understand, step-by-step guides for you to get started with contributing to OpenStreetMap and using OpenStreetMap and using OpenStreetMap data. If you are interested in running an OpenStreetMap workshop, check out the LearnOSM trainer resources.
Commoning in Times of Disaster: The Humanitarian OpenStreetMap Team
Just a few hours after the 7.0 magnitude earthquake hit Haiti in January 2010, a group of collaborators from the OpenStreetMap community began collecting all sorts of topographical data about the country – roads, towns, hospitals, government buildings. Within forty-eight hours high-resolution satellite imagery taken after the earthquake became available, and within a month over 600 people had added information to OpenStreetMap of Haiti.
This online map quickly became the default basemap for a wide variety of responders – search and rescue teams, the United Nations, the World Bank, and humanitarian mapping organizations such as MapAction.
Malla es una red de soporte y denuncia con la que afrontar de manera colectiva la represión durante el ejercicio de las libertades civiles y políticas
Nacida del trabajo de entidades, medios de comunicación y colectivos integrantes de la coalición Defender a quien Defiende, es también una herramienta de visibilización y análisis de las vulneraciones de los derechos humanos cometidas por cuerpos policiales y agentes de seguridad privada en el Estado español, especialmente en contextos de protesta social (derechos de reunión y manifestación prioritariamente).
Anti-eviction Mapping Project: Visualizing Bay Area Displacement and Resistance
The Anti-Eviction Mapping Project is a data-visualization, data analysis, and storytelling collective documenting the dispossession of San Francisco Bay Area residents upon gentrifying landscapes.
Pictogramas para la investigación y el mapeo colectivos, por Iconoclasistas
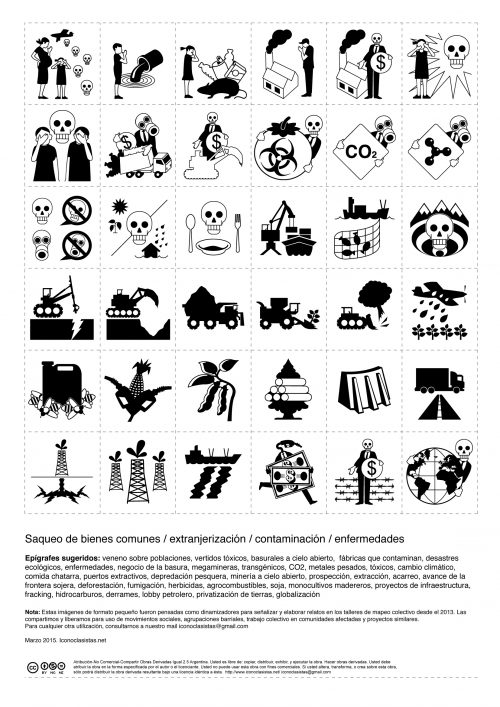
Los pictogramas son imágenes claras y esquemáticas que informan, señalizan y permiten elaborar colectivamente lecturas complejas sobre un territorio. Estos más de 200 dibujos pueden utilizarse para potenciar la investigación colaborativa, pues ayudan a representar situaciones y casos emblemáticos, permiten establecer rápidamente vínculos, identificar figuras clave, reseñar prácticas; y favorecen la visibilización de alternativas de organización y transformación territorial.
La tierra esclava: explotación agrícola de unos países, casualmente ricos, a otros, casualmente pobres
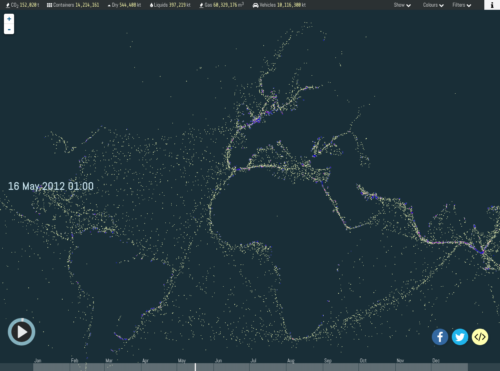
A set of maps for Airbnb.com by Stamen, showing the explosive growth of the service since it started in 2008
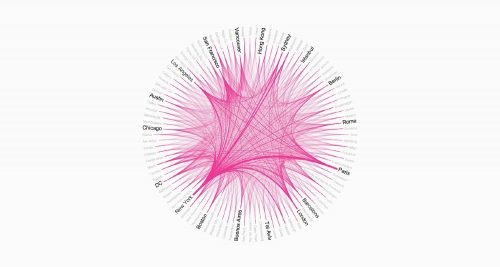
We designed a set of maps for Airbnb.com, showing the explosive growth of the service since it started in 2008. The first visualization represents Airbnb’s top 50 markets.
The thickness of the lines corresponds to the relative volume of travels between each pair.
Inside Airbnb: an independent, non-commercial set of tools and data that allows you to explore how Airbnb is really being used in cities around the world
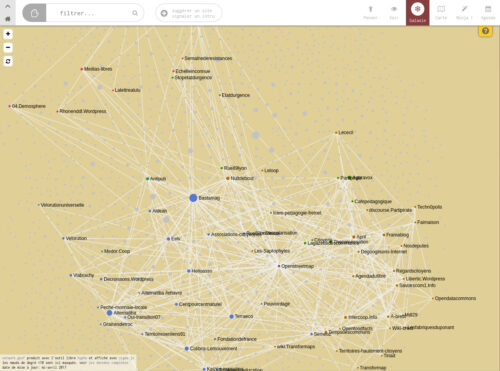
Kumu is a powerful data visualization platform that helps you organize complex information into interactive relationship maps
Quién mató a Escoitar. Un texto sobre cómo mueren los proyectos o cómo matarlos
En noviembre de 2013 Google dejó de dar soporte a la versión 2 de Google Maps, API en la que estaba enteramente basada la web de Escoitar. A partir de ese momento el mapa sonoro comenzó a experimentar fallos y serios problemas técnicos, cuya única solución pasaba por el desarrollo de una versión enteramente nueva de la página web. Fue, precisamente, el colapso definitivo del funcionamiento del mapa sonoro y la imposibilidad para encontrar financiación para la propuesta de renovación, lo que precipitó la desaparición del archivo.
Spip, el gestor de contenidos web con el que estaba construida la página web de Escoitar, no permitía la geolocalización de contenidos. GeoPress, el primer plugin de geolocalización para WordPress, la plataforma más popular de publicación de contenidos en Internet, se presentó en septiembre de 2006, dos meses después de la publicación de Escoitar, y los estándares web para compartir información geográfica en Internet como GeoRSS se consolidaron todavía más tarde, a lo largo de 2007. El desarrollo de Escoitar no solo constituyó la base para el primer plugin de geolocalización de Spip, que se publicó en marzo de 2007, si no que participó, en tiempo real, de los inicios de la cultura de la geolocalización y el geotagging en la red y de las ideas que había detrás de dichos movimientos.
Uno de los momentos clave que precipitó el colapso de este insostenible sistema de desarrollo fue la creación, por parte de Berio Molina y Chiu Longina, de un spin-off empresarial del colectivo llamado Pum Pun, en el año 2010. El potencial económico de la imagen de Escoitar y la enorme capacidad de desarrollo de los que se alimentó Pum Pun para ofrecer una forma de vida sostenible a dos de los miembros del equipo, lamentablemente, puso de manifiesto muchas de las debilidades del proyecto y de los desequilibrios que había entre los distintos miembros del colectivo, como el no haber remunerado nunca el trabajo de desarrollo.
A partir de ese momento, Berio Molina y Chiu Longina dejaron de contribuir a Escoitar para centrarse en su nueva empresa y, tras un período de razonables tensiones entre el colectivo y Pum Pun, yo tomé la decisión de no continuar trabajando de forma gratuita ni en el desarrollo, ni el mantenimiento de Escoitar. Como Enrique Tomás solamente participaba en el colectivo a través del proyecto noTours, en el momento en que dejé de mantener la web de Escoitar, el mapa sonoro quedó abandonado. Tres años después, cuando Google dejó de dar soporte a la versión 2 de Google Maps, no había un equipo de personas dispuestas a hacerse cargo. Berio Molina hizo algunos arreglos temporales para que la web siguiese en funcionando mientras se buscaba una solución, pero, sin una profunda renovación, el mapa sonoro quedaba sentenciado.