Autonomía digital y tecnológica

Código e ideas para una internet distribuida

Linkoteca. mapas


Se puede definir a la pendiente como la inclinación de un plano o de una superficie sobre un plano o superficie horizontal.

Esta pendiente se puede expresar o bien en tanto por ciento (%), por ejemplo, una pendiente del 15 %, o bien en grados (º) a través del ángulo de inclinación de la pendiente.

Para calcular la pendiente de una rampa, de un terreno o de una cubierta necesitamos conocer dos datos: la distancia de la pendiente y la altura de la pendiente.

Conocidos estos dos datos, habría que aplicar la siguiente formula para calcular la pendiente en tanto por ciento:

Pendiente (%) = (altura / distancia) x 100

Si lo que necesitamos saber es el ángulo de la pendiente, tenemos que tirar de la función arcotangente (arctg) que es la inversa de la tangente de un ángulo, por lo que habría que aplicar la siguiente formula:

Pendiente (º) = arctg (altura/distancia)

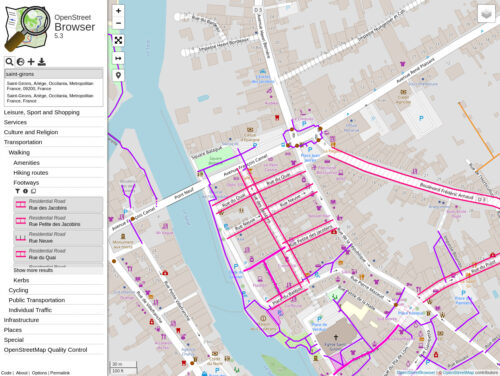
In QGIS version 3, there are built-in features to use raster and vector data from OpenStreetMap. There is no built-in possibility to upload changes back to a OpenStreetMap server directly from QGIS. For this purpose, please use one of the Editors.

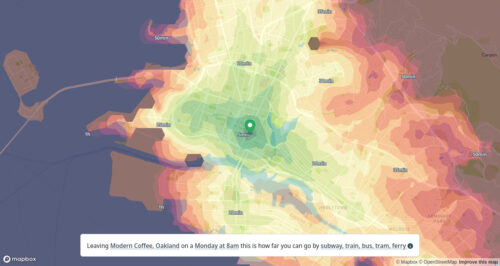
captura de pantalla de commutometer.com

Commutometer uses data openly shared by public transport agencies. If your bus is missing, your agency might not be sharing its data.

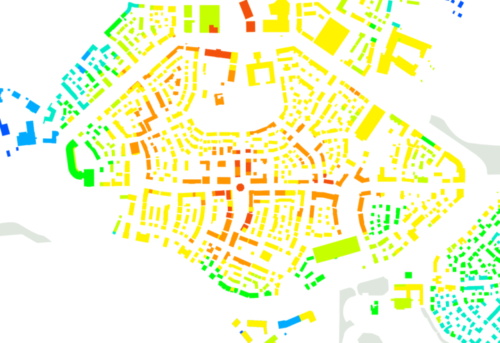
Poundbury Walkability index

The Walkability Index is a tool that allows existing places to be benchmarked and new proposals to be objectively tested in terms of whether they deliver car-dependence, with its associated problems – or walkability, with the social, economic and environmental benefits found in walkable places.

The location of everyday land uses – shops, offices, schools and healthcare facilities – has important effects on our movement choices: whether we reach them by walking or cycling, catching a bus or going by private car.

Sometimes there is no choice: low density, monofunctional housing estates create car dependence. This is not only harmful for the environment but damaging to our mental and physical health. Car-dependency influences obesity and loneliness. In contrast, walkable places are healthy and sociable places.

La iniciativa MAAAP busca la creación del primer “Territorio inteligente” mapeado por sus propios ciudadanos. Esta es una propuesta interactiva de ciencia ciudadana que tiene como objetivo implicar al alumnado de 4º de ESO, 1º de Bachillerato y Ciclos formativos de FP de Aragón en el entrenamiento de un algoritmo que nos permita diseñar ciudades más habitables.

How to apply a filter
* Right-click on the layer listed in panel Layers
* Choose Filter...
* The window Query Builder is displayed

How to build a query in Query Builder
* Double click on a field in Fields list
* Select All in Values
* Choose a operator from Operators
* Double click on a value in Values list
* Your expression is shown at the bottom of the window
* Click Test to have a preview of how many rows are returned
* Click OK to apply the filter
* The layer is displayed according to the filter applied (you see a filter icon aside the layer name in panel Layers)

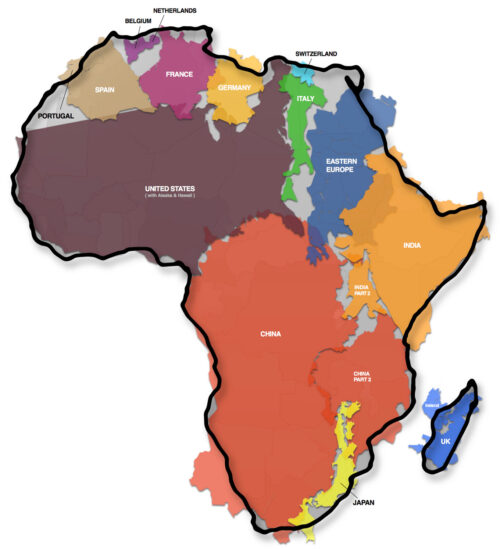
Captura de pantalla de The true size of Africa

The whole point being made was that we all have been taught geography mainly based on the Mercator projection – as the background in daily television news, the cover of my school atlas, in general the ubiquitous depiction of the planet.

But the basic fact is that a three-dimensional sphere being shown as a single two-dimensional flat image will always be subject to a conversion loss: something has to give…

The reason why Mercator was such an important advance is simple: on it one can draw straight lines to account for travel routes – in the days of the gigantic merchant fleets and naval battles an immensely valuable attribute.

Este material se concibe como una guía con pasos básicos para llevar adelante un proceso de mapeo junto a las y los estudiantes y a partir de algunas ideas y recomendaciones que puedan ser retomadas, ampliadas y mejoradas a partir de la experiencia, y de las temáticas y situaciones que se vayan dando en cada uno de los espacios educativos.

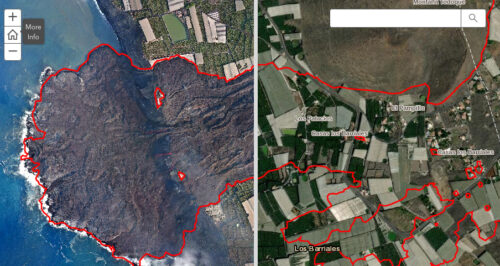
We are allowed to map certain facts from reference imagery in news articles etc.. -though this technically depends on where you are from-. You have to

  1. be fairly certain of the position of each object. They can be a few meters off, but you shouldn’t haphazardly map them.

  2. select sources which are reliable and mention them in your changeset sources or alternatively using the source and source:date tags.

  3. make sure you’re using the right imagery and (if any) offset. This can be adjusted in the editor’s layer menu (in iD, this is located in the right sidebar).

  4. be careful if/when touching existing objects. (You may want to contact the local community, if there is one, to discuss whether they want to map the event to begin with); This may change/remove objects on the map 1) ways which are used for routing 2) areas, such as buildings, or POIs which may be of interest for humanitarian aid.
    You will have to use the proper Lifecycle tags (in combination with area=yes where needed).

  5. be sure you know how to map with multipolygons where needed.

  6. as always, look on the wiki for tags and ask the community if you need help mapping.

OpenStreetMap offers many possibilities for creating high resolution paper maps. Unlike commercial map services such as Mapquest and Google Maps, there are only a few restrictions on what you can do with OSM images.

GUI written in Python to parse OSM (OpenStreetMap) files and render them onscreen. Layers may be toggled on/off and drawing may be customized.

This program allows a user to render OSM files within the GUI. The GUI enables the user to easily modify which layers are visible and the style of these layers.

The program exports maps as images.

a process by which you can generate your own custom-made stylized maps. A stylized map is a map where the user can specify which data layers are visualized, as well as define the style with which each layer is visualized. I will first describe the process through which you can write software to stylize maps, followed by an example of the Python software I wrote to perform this task.

Choose your region

The region is specified by a bounding box, which consists of a minimum and maximum latitude and longitude. Choose as small a region as will be useful to you, since larger regions will result in larger data files, longer download times, and heavier load on the server. The server may reject your region if it is larger than 1/4 degree in either dimension. When you’re first starting out, choose a very small region so that you can figure things out quickly with small data sets.

There are several ways of finding latitude and longitude values. Since we are interested in a bounding box, perhaps the clearest way is to use the bounding box selection features of the ‘export data’ link. On the homepage map pan and zoom to roughly the right area, and then click the ‘export data’ (link on the left). This sidebar display includes the four values you need for a bounding box matching the extents of the viewport. Click ‘Manually select a different area’ and then drag a box to select exactly the region you want.

Construct a URL for the HTTP API

You must now construct an API request URL as specified in the map request docs. In the URL, a bounding box is expressed as four comma-separated numbers, in this order: left, bottom, right, top (min long, min lat, max long, max lat). Latitude and longitude are expressed in decimal degrees. North latitude is positive, south latitude is negative. West longitude is negative, east longitude is positive. The method described in the previous section will give you suitable values.

Example:

https://api.openstreetmap.org/api/0.6/map?bbox=11.54,48.14,11.543,48.145

The API is limited to bounding boxes of about 0.5 degree by 0.5 degree and you should avoid using it if possible. For larger areas you might try to use XAPI, for example:

http://overpass.openstreetmap.ru/cgi/xapi_meta?*[bbox=11.5,48.1,11.6,48.2]

Refer to the XAPI page for details of other servers available.

Download the data

You can just type this URL into a browser if you want, but that may not work as well as you’d hope, especially if the data is large. If you know how to use them, command-line tools like wget and curl will do a better job.

If you’ve specified a region with a lot of data, you may have to wait a while before the HTTP response begins (the server is crunching your request). If your client times out, try setting options for a longer timeout, or choose a smaller region.

Here’s an example command line for wget:

wget -O muenchen.osm "https://api.openstreetmap.org/api/0.6/map?bbox=11.54,48.14,11.543,48.145"
Cartografia Critica del Estrecho de Gibraltar Cartografia Critica del Estrecho de Gibraltar

A lo largo del año 2004 un equipo colaborativo desarrolló el proyecto titulado “Una cartografía del territorio geopolítico del Estrecho de Gibraltar”. El producto visible de esta colaboración fueron dos mapas en papel (cara a y b) que presentaban lecturas alternativas de este territorio singular. El proyecto surgió de la red Indymedia Estrecho y vinculado a Fadaiat 2004, un encuentro de artistas, activistas y tecnólogos entre las dos orillas del Estrecho. Se trataba de presentar la visión desde la perspectiva de estas redes de este espacio geográfico como lugar de conflictos sociopolíticos, y también de presentar su propio trabajo como proyecto de transformación de este territorio. Las tres líneas principales de investigación-acción de Indymedia Estrecho se reflejaban en la cartografía: 1/ migraciones y frontera; 2/ nueva composición del trabajo, precarización; y 3/ comunicación independiente y conocimiento libre. En la cara a de la cartografía se mapeaban como flujos que atravesaban la frontera los procesos que venían ocurriendo en el Estrecho: militarización, migraciones, deslocalización del capital, comunicación y movimientos sociales. En la cara b se presentaban las redes de movimientos sociales activas a ambos lados de la frontera, así como sus proyectos políticos a corto y medio plazo – con lo que el mapa se convertía además en una herramienta de organización.

mapa dasimétrico y mapa coroplético

Hace poco hice un mapa de las desigualdades vía el uso de coropletas. Pero estos tipos de mapas suelen distorsionar la relación entre la verdadera geografía subyacente y la variable representada.

Se debe a que las divisiones administrativas no suelen coincidir con la realidad geográfica. Además, grandes areas aparentan tener un peso que no tienen. Para reflejar mejor la realidad se hace uso de distribuciones más realista de la población como puede ser el uso de suelo.

Con técnicas de Sistemas de Información Geográfica es posible redistribuir la variable de interés en función de una variable más realista a menor unidad espacial. En este caso usé el uso de suelo urbano con 100 m de resolución.

Captura de pantalla de app.dvf.etalab.gouv.fr

Cette application est proposée par Etalab, département de la DINUM, et permet de visualiser les données DVF (demandes de valeurs foncières), correspondant aux mutations à titre onéreux réalisées les 5 dernières années. Les données DVF brutes sont téléchargeables sur le site https://www.data.gouv.fr depuis le 24 avril 2019 et sont produites par la direction générale des Finances publiques. Vous y trouverez des informations sur le cadre technique et légal de cette publication.

A quoi correspond le prix affiché ?

Il s’agit dun prix «net vendeur», c’est-à-dire ne comprenant ni frais d’agence immobilière, ni frais de notaire. En cas de vente de mobilier (une cuisine équipée par exemple) avec le bien immobilier, le montant de ce mobilier n’est pas compris dans le prix affiché. La TVA est incluse.

Captura de pantalla de france-geojson.gregoiredavid.fr

Le projet Github france-geojson propose au format GeoJSON les cartes des régions, départements, arrondissements, cantons et communes de France (métropole et départements d’outre-mer) à partir des données publiées par l’IGN et l’INSEE.

Ce site permet de rechercher, visualiser et télécharger individuellement chacun de ces fichiers dans un format optimisé. Pour plus de détails ou pour accèder à la version non optimisée des tracés, cliquez sur le bouton ci-dessous.

A pretty specific title, huh? The versioning is key in this map-making how-to. D3.js version 5 has gotten serious with the Promise class which resulted in some subtle syntax changes that proven big enough to cause confusion among the D3.js old dogs and the newcomers. This post guides you through creating a simple map in this specific version of the library. If you’d rather dive deeper into the art of making maps in D3 try the classic guides produced by Mike Bostock.